How to Use Salary Data for Career Planning in 2026

Salary data career planning is the practice of using accurate, occupation-specific compensation benchmarks to make informed decisions about your career path, job moves, and salary negotiations. Professionals who rely on a single number or a vague sense of “market rate” consistently leave money on the table or aim at the wrong targets. The most effective approach combines BLS OEWS wage percentiles, salary calculators, and real-time job postings into a layered system. Fairpayguide exists to make that process faster and more transparent for professionals at every stage.
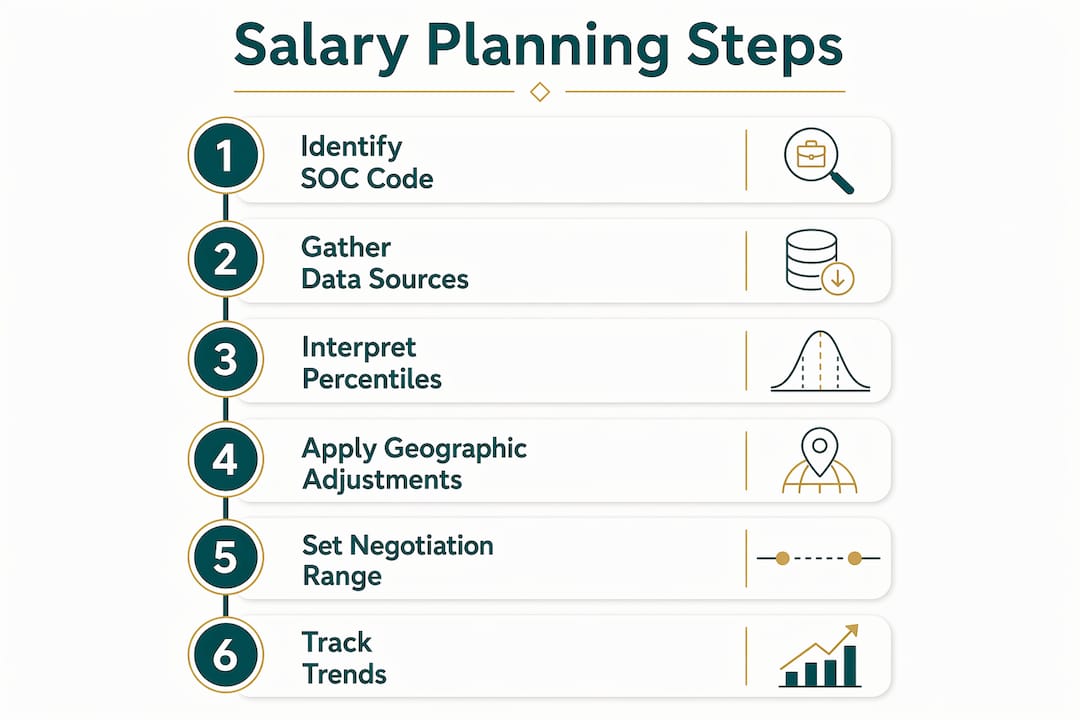
How to use salary data for career planning: the core framework
Salary data career planning works best when you treat compensation benchmarks as a range, not a single number. The BLS Occupational Employment and Wage Statistics program publishes annual wage percentiles at the 10th, 25th, 50th, 75th, and 90th levels for hundreds of occupations across national and metro areas. That range tells you far more than a median alone. A software developer in Austin sitting at the 50th percentile earns a different figure than one in San Francisco, and both differ from the national median.
The key insight is this: your negotiation target should be a percentile band, not a single figure. Professionals who target the 50th–75th percentile range enter negotiations with a defensible position grounded in real market data. Those who cite a single average number often cannot explain why they deserve it.

Beyond BLS, platforms like Payscale and Salary.com add employer-reported data and total compensation breakdowns. Tools like the Salary Expectations Calculator factor in bonuses, equity, and benefits to give you a true total compensation picture. Using multiple sources together reduces the risk of over-anchoring on one data point.
Key salary data sources to know:
- BLS OEWS: Annual percentile data by occupation and geography. Free, government-verified, and updated yearly.
- Payscale and Salary.com: Employer-reported data with total compensation breakdowns.
- Job postings with pay transparency: Real-time market signals from active hiring.
- Salary databases and community platforms: Peer-reported figures that reflect current market conditions.
Pro Tip: Before pulling any BLS data, identify the correct SOC occupational code for your actual job duties, not your job title. Choosing the wrong SOC category causes systematic errors in your salary benchmarks, since OEWS data is organized by occupational classification, not by what your employer calls your role.
What are the best salary data sources and how do you interpret them?
The BLS OEWS program is the most reliable public source for occupation-specific wage data. It covers over 800 occupations and publishes separate tables for national, state, and metropolitan area wages. The annual update cycle means the data reflects real hiring conditions, not outdated surveys.
Interpreting percentiles correctly is the skill most professionals skip. The 50th percentile is the median. Half of workers in that occupation earn less, half earn more. The 75th percentile tells you what top-quartile earners make. If you have five or more years of experience and manage a team, targeting the 75th percentile is defensible. If you are entering a new field, the 25th–50th range is more realistic.
Geographic adjustment matters as much as occupation selection. A marketing manager in New York City earns significantly more than one in Memphis, even within the same percentile band. Always pull metro-level data when it is available. National figures are useful for context but should never anchor your negotiation in a specific city.
Industry variation adds another layer. A data analyst in finance earns more than the same role in education. BLS cross-references occupation and industry in some tables, and platforms like Salary.com let you filter by industry sector. Use both to build a complete picture before you set any expectations.
How to triangulate salary sources and set your negotiation anchor
Building a defensible salary range requires combining at least three data points. A single source, even BLS, reflects a snapshot. Combining sources gives you a range you can defend under pressure.
- Pull BLS OEWS percentile data for your specific occupation code and your target metro area. Note the 25th, 50th, and 75th percentile figures.
- Check active job postings in your area for the same role. States with pay transparency laws, including California, Colorado, and New York, require salary ranges in postings. These figures reflect what employers are willing to pay right now.
- Run a total compensation estimate using a tool like the Salary Expectations Calculator. Base salary is only part of the picture. Bonuses, health benefits, retirement contributions, and equity can add 20–40% to your total package.
- Cross-reference with peer-reported platforms like Payscale or Glassdoor to check whether your range aligns with what actual workers report.
- Select your anchor percentile based on your experience level, the scope of the role, and your geographic market. Document your reasoning in writing before the negotiation.
The most common mistake is relying on one source and presenting a single number. Employers expect candidates to negotiate. A range grounded in multiple sources signals preparation and market awareness.
Common pitfalls to avoid:
- Using national averages when metro data is available.
- Ignoring total compensation and focusing only on base salary.
- Failing to match your job duties to the correct SOC code before pulling BLS data.
- Anchoring too low because you fear rejection.
Pro Tip: Document exactly why you chose your target percentile before any negotiation. Write down your years of experience, the scope of the role, and the specific data sources you used. Justifying your anchor percentile with a clear written rationale is one of the most underused leverage points in salary discussions.
How does salary data help you map a realistic career path?
Career path mapping is the process of identifying multiple realistic routes from your current role to a target role, with salary ranges and transition costs attached to each step. Most professionals skip the feasibility check and chase the highest median pay they can find. That approach fails more often than it succeeds.
Tools like the Career Path Explorer generate multiple transition paths using BLS and O*NET data. They show skill overlap between your current role and target roles, estimated training investments, and salary ranges at each step. A data analyst considering a move to data science sees not just the salary difference but the certification gap and realistic timeline.
The table below shows how salary data pairs with feasibility factors in career path planning:
| Career move | Salary range signal | Key feasibility factor |
|---|---|---|
| Analyst to data scientist | Strong upward salary jump | Requires Python, ML skills, often a graduate credential |
| Marketing manager to product manager | Moderate salary increase | Needs technical product exposure and cross-functional experience |
| Software engineer to engineering manager | Lateral or slight increase initially | Requires demonstrated leadership, not just technical depth |
| HR generalist to compensation analyst | Moderate salary increase | Needs data analysis skills and compensation certification |
Salary data informs the timing of your next move, not just the destination. If the median salary for your target role has grown steadily over three years, moving sooner captures more of that growth. If it has flattened, waiting to build more skills may produce a better outcome.
Factors to weigh alongside salary data:
- Skill overlap between your current and target role.
- Certification or degree requirements and their cost.
- Market demand for the target role in your geography.
- Realistic timeline to qualify for the transition.
Chasing the highest median pay without a feasibility check is one of the most reliable ways to stall a career. Reliable career planning integrates salary data with skill overlap and transition roadmaps, not just compensation figures.
How do you track salary trends over time for ongoing career intelligence?
Salary benchmarks change. A range that was accurate in january 2024 may be meaningfully different by june 2026. Professionals who treat salary data as a one-time lookup miss shifts in labor market conditions that directly affect their negotiation position.
Indeed Hiring Lab reported 2.4% yearly posted wage growth overall in may 2026, with low-wage occupations growing at 2.7% year over year. That gap matters for professionals in entry-level or support roles who may have more negotiating room than they realize.
A practical tracking routine takes less time than most professionals expect:
- Set a monthly calendar reminder to check one salary source. Rotate among BLS OEWS, Payscale, Glassdoor, and active job postings each month.
- Log the median and 75th percentile for your occupation and location in a simple spreadsheet. Track the date alongside each entry.
- Note any significant shifts in posted salary ranges from job listings. A sudden increase in posted ranges signals rising demand.
- Review your personal salary trend line every six months. Compare your current compensation to the market percentile you tracked when you last negotiated.
Tracking salary changes over time gives you a personal trend line that tells you when the market has moved past your current pay. That is the clearest signal that it is time to negotiate, apply elsewhere, or make a career move. Many professionals treat benchmarks as static and miss this window entirely.
Pro Tip: Use a shared spreadsheet or a simple note-taking app to log salary data with dates. After six months, you will have a personal salary trend line that no single platform can give you. That trend line is your most credible negotiation asset.
Key Takeaways
Professionals who use salary data for career planning with a layered, multi-source approach consistently negotiate more effectively and make better-timed career moves than those who rely on a single benchmark or a vague sense of market rate.
| Point | Details |
|---|---|
| Use percentile bands, not averages | Target the 50th–75th percentile range and document why your experience justifies your anchor. |
| Match duties to SOC codes | Incorrect occupational classification produces systematically wrong salary benchmarks before you even start. |
| Triangulate at least three sources | Combine BLS OEWS, job postings, and a total compensation calculator for a defensible range. |
| Map career paths with feasibility data | Pair salary range data with skill overlap and training costs before committing to a transition. |
| Track benchmarks monthly | Log median and 75th percentile figures over time to identify when the market has moved past your pay. |
Why most professionals use salary data wrong
The most common mistake I see is treating salary data as a single lookup rather than a continuous practice. A professional pulls one number from a salary site, anchors their negotiation to it, and walks away confused when the employer pushes back. The number was real. The context was missing.
Percentile rationale is the piece most people skip. Knowing the 75th percentile for your role is useful. Knowing why you belong there, based on your specific experience, scope, and geography, is what makes the number stick in a negotiation. I have watched professionals with strong cases lose ground simply because they could not explain their anchor. The data was right. The documentation was not there.
Career path mapping is where salary data does its most underrated work. Most professionals use it only to prepare for a negotiation in their current role. The smarter use is to evaluate transition feasibility before committing to a path. A salary benchmarking framework that includes skill overlap and realistic timelines prevents the expensive mistake of chasing a high median salary into a role you are not yet qualified for.
The professionals I respect most treat salary intelligence the way good investors treat market data. They track it consistently, update their assumptions regularly, and act when the data supports a move. They do not wait for a crisis to check their market value.
— Obinna
Fairpayguide tools for salary data and career planning
Fairpayguide brings salary transparency to professionals across every field and location. The Salary Lookup tool gives you real-time salary ranges by job title and location, so you can build your negotiation range in minutes rather than hours of manual research.
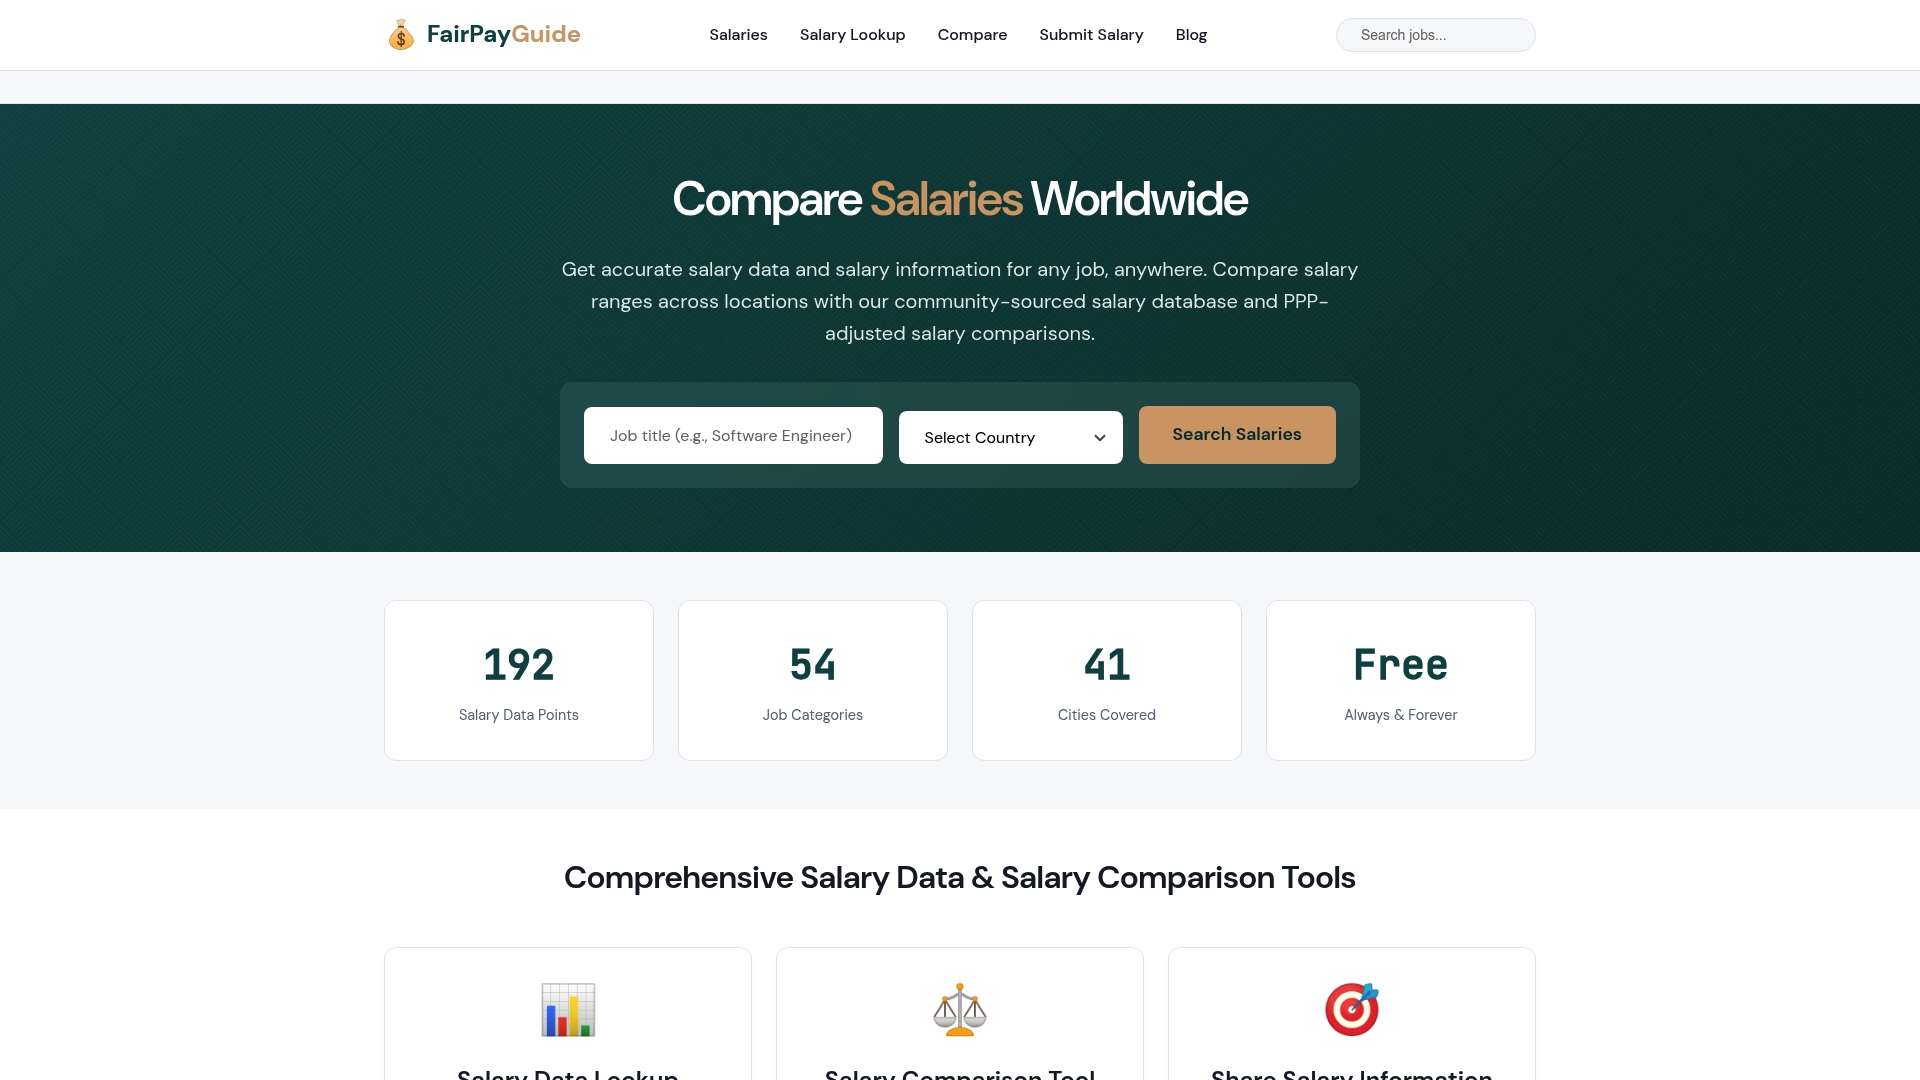
The Salary Comparison Tool lets you compare compensation across occupations, locations, and industries side by side. For professionals planning a career transition, that comparison is the fastest way to see whether a target role pays what you expect in your specific market. You can also submit your salary anonymously to contribute to the market data that helps other professionals benchmark accurately. Use these tools as part of your monthly salary tracking routine to keep your career intelligence current.
FAQ
What is salary data career planning?
Salary data career planning is the practice of using occupation-specific and location-specific compensation benchmarks to guide career decisions, set negotiation anchors, and map realistic career transitions. It relies on sources like BLS OEWS, salary platforms, and job postings rather than guesswork.
Which salary data source is most reliable?
The BLS OEWS program is the most reliable public source because it publishes annual wage percentiles by occupation and geography, verified by federal data collection. Payscale and Salary.com add employer-reported and total compensation data that complement BLS figures.
How do I use salary percentiles in a negotiation?
Target the 50th–75th percentile band for your occupation and location, then document why your experience and role scope justify that range. Justifying your anchor with specific reasoning is more persuasive than citing a number alone.
How often should I update my salary benchmarks?
Update your salary benchmarks at least once a month by rotating among BLS OEWS, job postings, and salary platforms. Tracking salary data consistently over six months gives you a personal trend line that signals when to negotiate or move.
Can salary data help me plan a career change?
Salary data paired with feasibility tools like the Career Path Explorer shows skill overlap, training costs, and salary ranges for each transition step. That combination prevents the common mistake of targeting a high-paying role without a realistic path to qualify for it.